

Rates Hold at 6.00%. And We’re Marking the Month.
The Week: Market Intelligence for March 1–7, 2026


Something shifted this week. Not dramatically — but meaningfully.
Mortgage rates are holding at 6.00%, near a three-year low. The prediction market we introduced last week resolved: traders had placed a 98.5% probability on U.S. home values landing between $420,000 and $425,000 by March 1. Parcl Labs confirmed the number. The market called it again.
And it’s Women’s History Month.
Each of those things matters on its own. Together, they tell a story about who this market was built for, who was excluded from it, and what it means that the data today — if you know how to read it — is working in your favor.
Here’s what happened this week across the rental, homebuying, and investment markets.
The Rental Market: The Search Window Is Open — And It’s Earlier Than You Think
Here is something most renters don’t know: the best time to negotiate your lease is not when you’re in it. It’s before the competition arrives.
Traditionally, the rental market peaked in summer. Apartment List data confirms that leases have historically concentrated in June through August — families moving before school starts, college students locking in apartments, professionals relocating before fall. That pattern still exists. But it has shifted materially since 2022.
Renter search activity — apartment inquiries, shortlist additions, applications — now peaks in Q1. Over 30% of annual renter interest activity now occurs in the first quarter of the year, up sharply from pre-pandemic norms. Peak rent growth has occurred in March, not June, for three consecutive years, according to Apartment List’s December 2025 Rental Management Report. That means the moment when your negotiating leverage is highest and competition is lowest is right now — not in the fall when the majority of leases are signed, and not in summer when landlords have their pick of applicants.
The underlying data supports the leverage. According to the Apartment List National Rent Report for March 2026, the national median monthly rent stands at $1,357 — down from $1,377 a year ago. Year-over-year rents are still declining in 34 of the 54 largest metropolitan areas. The national vacancy index hit 7.4%, a record high since 2017. Average list-to-lease time is now 40 days — more than twice the pace of mid-2021.
What that means: landlords are waiting longer for tenants than at any point in recent history. The unit sitting vacant costs more than locking in a tenant at a negotiated rate. That calculus is real and it is in your favor right now.
Why is vacancy this elevated? The apartment construction boom of 2023 and 2024 delivered more than 600,000 new multifamily units in 2024 alone — the most in a single year since 1986. That supply wave has been working its way through the system ever since. It is not permanent. Completions are projected to drop significantly in 2026 as the pipeline contracts. The vacancy and concession environment that creates tenant leverage will gradually tighten.
The Cotality Single-Family Rent Index confirms the same dynamic at the single-family level, with rent growth slowing to just 1.2% year-over-year in December 2025. Eighteen of the 50 largest metros posted outright rent declines.
What This Means for You:
If your lease renews between now and September, the search and negotiation window is open — and it is earlier than most renters realize. Ask for what the data supports: rent at or below the asking price in markets that are still declining year-over-year, a free first month in Sun Belt markets where concessions remain widespread, and waived application and deposit fees. In Denver, Phoenix, Jacksonville, Raleigh, and Austin, more than 50% of properties are currently offering at least one month free, according to Apartment List. Flexible lease terms — month-to-month options, early termination rights — are also on the table in ways they were not two years ago.
Your landlord is still operating in a market where the data favors you. That will not be true indefinitely.
→ The Rent Negotiation Toolkit walks you through exactly this conversation.
The Homebuying Market: January Was Weather. The Trend Is Not.
Here is the most important context for this week’s homebuying data: January was cold, wet, and anomalous. It does not tell the full story.
According to the NAR Existing-Home Sales report for January 2026, existing-home sales fell 8.4% from the prior month — a sharp drop. Median existing-home price: $396,800. Inventory: 3.7 months supply. NAR Chief Economist Dr. Lawrence Yun acknowledged directly: “The below-normal temperatures and above-normal precipitation this January make it harder than usual to assess the underlying driver of the decrease and determine if this month’s numbers are an aberration.”
It appears they were. The February Existing-Home Sales report releases Tuesday, March 10 — two days after this edition publishes. The headline, already confirmed by NAR: existing-home sales accelerated 4.2% in February. The January dip was weather, not trend.
What the data underneath January confirmed, regardless of the month-over-month noise: NAR’s Housing Affordability Index hit 116.5 — the best reading since March 2022. That means the median household income is 116.5% of what is needed to qualify for the median-priced home at current interest rates. Affordability improved for the seventh consecutive month.
Dr. Yun on what that means in buyers: “With mortgage rates nearing 6%, an additional 5.5 million households that could not qualify for a mortgage one year ago would qualify at today’s lower rates. Unless housing supply increases, these additional potential buyers becoming active in the market could simply push up home prices.”
That is the tension at the center of this market. Five and a half million newly qualifying households. Most are still waiting. When they move, they move into the same constrained inventory — which means the buyer who acts in Q1 or Q2 is competing against fewer people than the buyer who waits for the fall.
Some markets are already absorbing that demand. Year-over-year pending sales gains in January were led by Saint Louis, up 8.0%, and Virginia Beach–Chesapeake–Norfolk, up 7.6%. These are not coastal luxury markets. They are markets where buyers recognized the moment.
Policy Update: The House passed the Housing for the 21st Century Act (H.R. 6644) on February 9 by a vote of 390–9. The legislation targets supply-side barriers — zoning restrictions, permitting delays, development constraints. The Senate invoked cloture on March 2, bringing it to the floor for a vote. If enacted, it would be the most significant federal housing supply legislation in decades. We are watching.
What This Means for You:
The payment math has changed. At today’s 6.00% on a $396,800 home with 10% down, the monthly principal and interest is approximately $2,141. At last year’s 6.63%, that same home cost $2,316 per month. That is $175 back in your pocket every month — and you are competing against fewer buyers than at almost any point in the last three years.
If you have been pre-approved in the last 12 months, revisit that approval now. Your qualifying amount has improved. If you have not started the process, this is the week to begin.
A free resource worth knowing: downpaymentresource.com — search down payment assistance programs by state and income level. Most buyers do not know these exist.
The Investment Market: Supply Is Contracting. The Window Is Narrowing.
Last week we covered the full institutional picture: $165.5 billion in 2025 apartment investment volume, cap rate compression to 5.7%, and the capital positioning thesis from Zaransky and Chang. This week, one update worth tracking.
The supply contraction that institutional investors have been betting on is now showing in the data. Multifamily completions are projected to fall sharply in 2026 as the construction pipeline — which delivered more than 600,000 units in 2024 alone — works through its backlog and starts decline. The vacancy and concession environment that has characterized the last two years will tighten. Landlords who have been competing for tenants will regain leverage. Cap rates will compress further as investors price in that tightening.
According to MSCI Real Capital Analytics data via Arbor Realty Trust’s U.S. Multifamily Market Snapshot for February 2026, apartment fundamentals are being watched most closely in Midwest and Northeast metros — markets with minimal new development pipelines and recent market-leading rent growth. Not headline markets. Disciplined ones.
What This Means for You:
Underwrite conservatively — model 1 to 2% annual rent growth, not 3 to 5%. Prioritize cash flow over appreciation. Know your local vacancy rate, not just the national average. The window to get ahead of repricing is narrowing, not widening.
What We’re Watching: The Market Called It

Last month, prediction markets assigned a 98.5% probability to U.S. median home values landing between $420,000 and $425,000 by March 1, 2026.
Parcl Labs confirmed: $420,940.
The market called it. Again.
Here is how it resolved across six markets, as of March 1, 2026 at 7AM — before Parcl confirmed the final values:
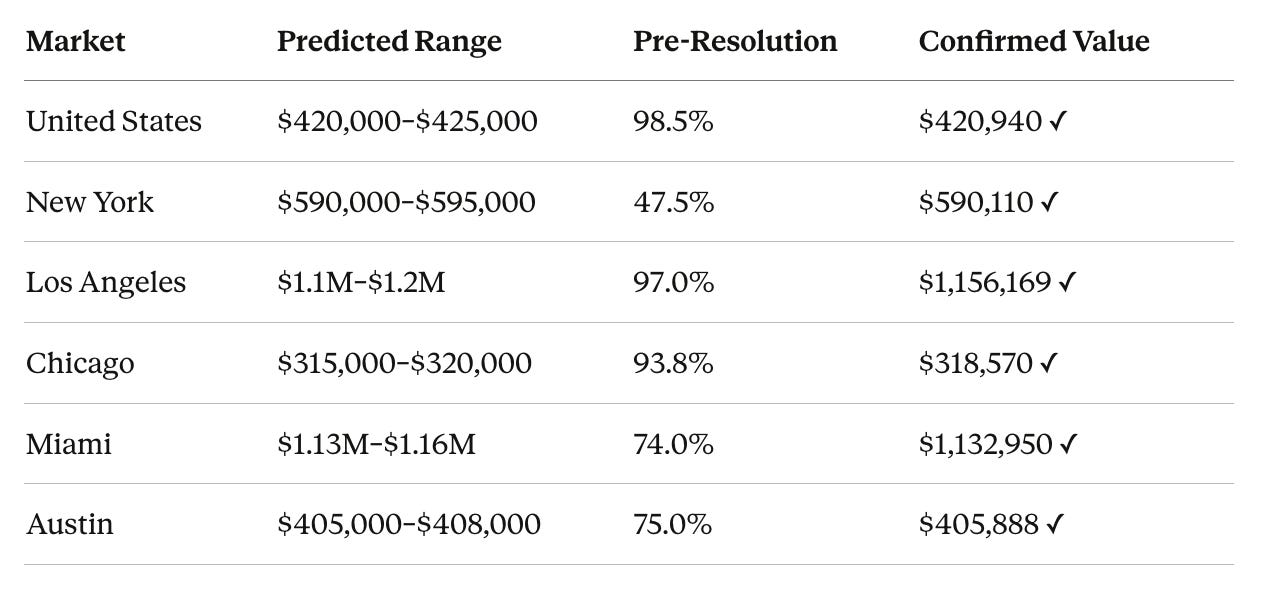
New York is worth noting: the market was genuinely split going in — $580–585k was trading at 48.5% against $590–595k at 47.5%. Parcl’s data settled it within hours. That is the mechanism working exactly as designed.
Austin tells a different story. At $405,888, it is the only market in this group showing a clear two-year price decline — down significantly from its 2023–2024 peak. The prediction market priced that correction accurately.
Why does this matter beyond the numbers? Prediction markets aggregate what thousands of informed traders believe, with real money behind every position. Unlike surveys or economist projections, participants cannot revise their forecast after the fact. Over time, markets that operate this way have proven more accurate than most institutional forecasts precisely because of that accountability.
Parcl Labs provides the daily housing price data that settles each market. Their index tracks median home values across all property types — single-family, townhomes, and condos — updated daily, with a 0.98 correlation to the Case-Shiller index but without the three-month lag.
New markets tracking April 1 home values are now open. Traders currently assign 42% probability to the U.S. median landing between $420,000 and $422,500 — a tighter range, and lower confidence than last month. We are watching.
Each month, prediction markets forecast where home values will land. Each month, we report whether they got it right.
Women’s History Month
Where you live — and why it matters.

The women who were shut out of homeownership in 1950, 1960, and 1970 were not just denied a loan. They were denied the single most reliable vehicle for building intergenerational wealth in American history. The wealth gap we navigate today was not accidental. It was constructed — through redlining, through lending discrimination, through the legal requirement of a husband’s signature to access credit.
The Equal Credit Opportunity Act of 1974 changed the law. It did not close the accumulated gap in wealth, homeownership rates, and generational asset-building that 30-plus years of exclusion had created. That gap is still being closed, in the market, one transaction at a time.
Fifty years later: single women now represent 20% of all homebuyers, compared to 8% for single men — despite lower average household incomes, in a market that remains structurally expensive. That is not a footnote. That is the story of this market.
We are spending Women’s History Month the way we spend every week: connecting the past to the present, and the present to your next decision.
“Until 1974, women couldn’t get mortgages without a male co-signer. We’ve been making our own opportunities ever since.” — Women + Real Estate™
Mortgage Rates: 6.00%

The 30-year fixed mortgage rate as of March 5, 2026, per the Freddie Mac Primary Mortgage Market Survey: 6.00%. Slightly up from 5.98% last week, but holding near its lowest level since 2022. The 15-year fixed averaged 5.43%, down from 5.44% the prior week.
One year ago: the 30-year averaged 6.63%. The 15-year averaged 5.79%.
Freddie Mac’s read: rates are spurring activity from buyers, sellers, and owners alike. Purchase applications are running ahead of last year’s pace. Refinance activity is up.
One note worth keeping in context: the 3 to 4% mortgage rate environment of 2020 and 2021 was emergency monetary policy. The Federal Reserve has been clear it will not recreate those conditions. The historical 50-year average for 30-year fixed rates is approximately 7 to 8%. Six percent is historically reasonable — and it is the lowest it has been in three and a half years.
The Strategic Takeaway
This week’s data holds together as a single argument.
Renters still have leverage, but the window to use it is earlier than most people think — and it is open right now. The search and negotiation moment peaks in Q1, not summer. Landlords are still waiting longer for tenants than at any point in recent history. By the time the fall lease season arrives, the leverage shifts.
Buyers have the most favorable combination of affordability and low competition since March 2022. February sales confirmed the January weather dip was an aberration: existing-home sales accelerated 4.2%. Rates are holding near a three-year low. Five and a half million additional households now qualify. Most are still waiting — which means the informed buyer is competing against fewer people.
Investors are operating in a market that rewards discipline. Institutional capital has been positioning for two consecutive years ahead of a supply contraction that is now showing in the data. The window to get in front of repricing is narrowing, not widening.
And the prediction market answered its question for the second time. If it continues to do so, we have access to something genuinely new: financially accountable, crowd-sourced forward guidance on where home values are headed. We will keep tracking it here.
The market is not waiting for perfect conditions. It is moving. The question is whether you are positioned to move with it.
Want market intelligence like this delivered to your inbox every week?
Prefer to listen? This story is featured on the Women + Real Estate™ Podcast and everywhere you get your podcasts: Spotify | Apple | YouTube

The Offer: Everything's Negotiable™ — launching soon. Join the early access list →

Got questions? Reply to this email — I read every response.
See you next week, Eve
Everything’s Negotiable.
Eve Moss, Founder, Women + Real Estate™ womenplusrealestate.com
The Women + Real Estate™ Opportunity Fund: a portion of all product sales fund scholarships and micro-grants for women in housing transitions. When you purchase any Women + Real Estate product, you’re helping another woman negotiate from strength.
This newsletter is for educational purposes only and does not constitute legal, financial, or investment advice. The PREP Framework™ and Everything’s Negotiable™ are trademarks of Chavah Media Ltd.
© 2026 Chavah Media Ltd. | Women + Real Estate™. All rights reserved.